Coming Apart: The State of White America, 1960-2010
Charles Murray (2012)
Chapter 2 - The Foundations of the New Upper Class
The Enabler: Wealth
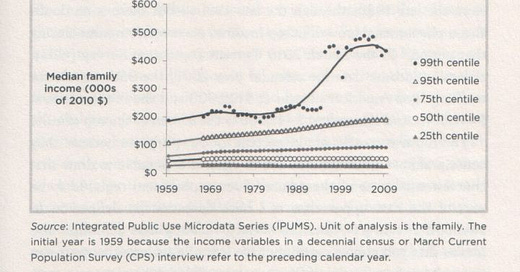
The poor didn’t actually get poorer – the growth of in-kind benefits and earned-income tax credits more than made up the drop in pretax cash income – but they didn’t improve their position much either. 5
Chapter 6 - The Founding Virtues
Industriousness
… Francis Grund wrote that during a decade of life in the United States, “I have never known a native American to ask for charity. No country in the world has such a small number of persons supported at the public expense. . . . An American, embarrassed by his pecuniary circumstances, can hardly be prevailed upon to ask or accept the assistance of his own relations; and will, in many instances, scorn to have recourse to his own parents.” 14
Chapter 7 - Belmont and Fishtown
In which I describe two fictional neighborhoods called Belmont and Fishtown, and explain how I will use these neighborhoods to track the founding virtues from 1960 to 2010.
Two Neighborhoods
Belmont
The real Belmont, zip code 02478, centile 97, is a suburb of Boston and the home of people who are mostly in the upper-middle class. Many people in the professions live in Belmont – physicians, attorneys, engineers, scientists, university professors – alongside business executives and managers of nonprofits and government agencies. The people of Belmont are highly educated – 63 percent of the adults had BAs in 2000. It is affluent, with a median family income of $124,200 in 2000.
The fictional Belmont that I will be using in part 2 differs from the real Belmont in that there are no exceptions. For whatever database I am using, I assign unmarried persons to Belmont if and only if they have at least a bachelor’s degree and are managers, physicians, attorneys, engineers, architects, scientists, college faculty members, or in content-production jobs in the media (e.g., journalists, writers, editors, directors, producers). I assign married persons to Belmont if either they or their spouse has at least a college degree and is in one of those occupations.
Fishtown
The real Fishtown, zip code 19125, centile 8, is located in the north-eastern part of Philadelphia. It has been a white working-class neighborhood since the eighteenth century. In the real Fishtown, some people still don’t finish high school, but most get their diploma and go straight to work. Some have gotten technical training after high school. Some have attended community college or given a four-year college a try for a year or two. Some have been in the military, where they have received technical training. But completed college educations are in Fishtown – only 8 percent of the adults had college degrees in 2000.
Fishtown has many highly skilled blue-collar workers … but also many people in midskill occupations … Low-skill jobs are also heavily represented among the breadwinners in Fishtown … Most families in Fishtown have incomes somewhere in the bottom half of the national income distribution – the median family income in 2000 was only $41,900 – and almost all the people who are below the poverty line live in a place like Fishtown.
In my fictional Fishtown, I once again lop off the exceptions. To be assigned to Fishtown, the basic criteria are a blue-collar, service, or low-level white-collar occupation, and no academic degree more advanced than a high school diploma. [...]
Chapter 8 - Marriage
Children and Marriage
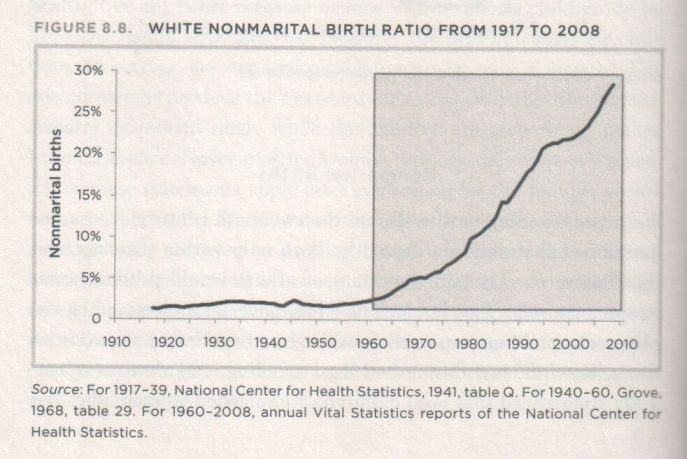
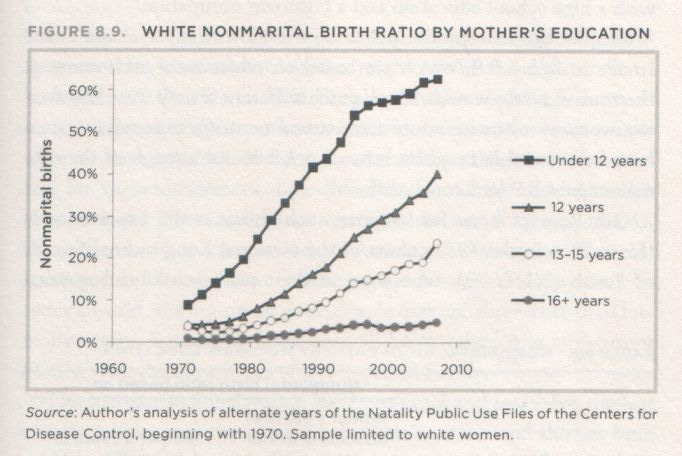
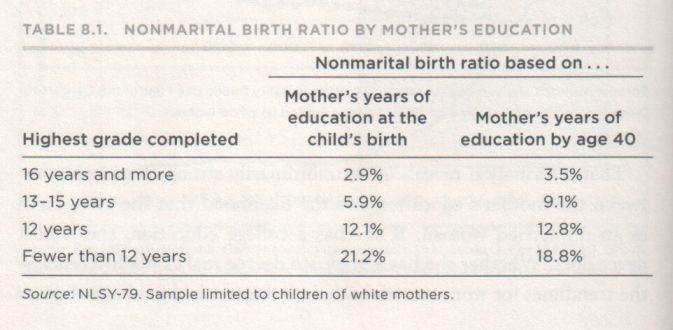
To see which white women were having those babies, I turn to the national birth records assembled by the National Center for Health Statistics (NCHS). Since 1970, the NCHS has included information on the mother’s years of education at the time of birth.
So whereas I cannot calculate precise numbers for the trends in Belmont and Fishtown, you can get a good idea of what they would look like by imagining a line for Belmont that is close to the line for women with sixteen or more years of education, but slightly higher, and a line for Fishtown that is moderately higher than the line for women with twelve years of education. My best estimate is that nonmarital births in Belmont as of 2008 were around 6 to 8 percent of all births, whereas in Fishtown they were around 43 to 48 percent of all births.
It’s Even Worse Than It Looks
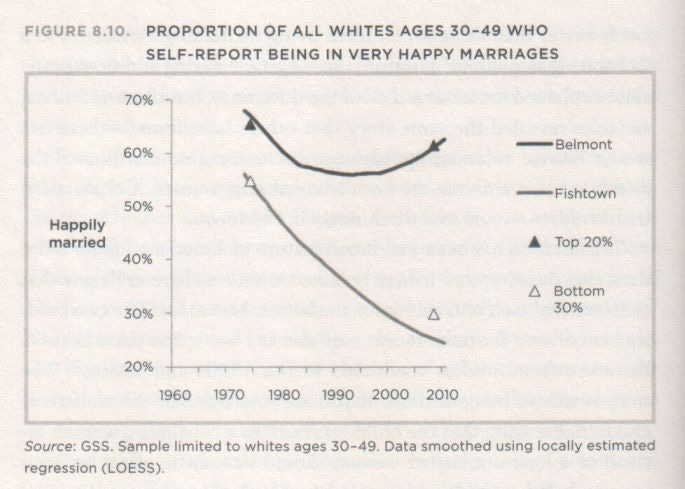
… Instead of thinking about percentages of happy and unhappy people, think about the role of marriage as the bedrock institutions around which communities are organized and, writ large, around which the nation is organized. A neighborhood in which that function is being performed will be characterized by a large core of happy marriages.
… Twenty-six percent is arguably no longer a large enough group to set norms or to serve as a core around which the community functions.
Chapter 9 - Industriousness
What Whites Did About Work: Men
Until recently, healthy men in the prime of life who did not work were scorned as bums. Even when the man was jobless through no fault of his own, America’s deeply rooted stigma against idleness persisted – witness the sense of guilt that gripped many men who were unemployed during the Great Depression even though they knew it wasn’t their fault they were unemployed.
The Unbelievable Rise in Physical Disability
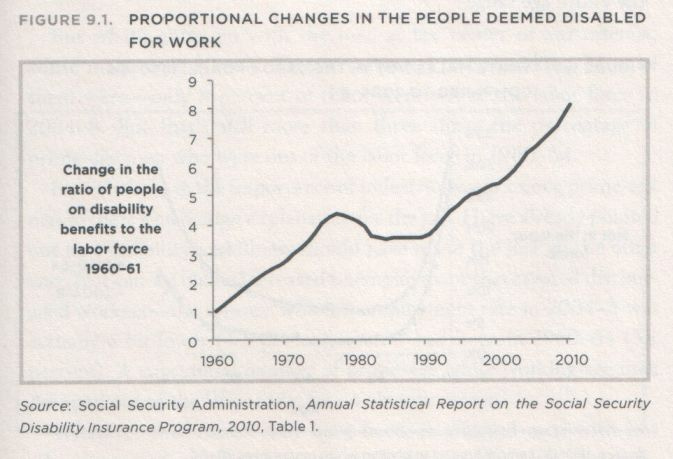
That norm has softened. Consider first the strange case of workers who have convinced the government that they are unable to work. The percentage of workers who actually are physically or emotionally unable to work for reasons beyond their control has necessarily gone down since 1960. Medical care now cures or alleviates many ailments that would have prevented a person from working in 1960. Technology has produced compensations for physical handicaps and intellectual limitations. Many backbreaking manual jobs in 1960 are now done by sitting at the controls of a Bobcat. Yet the percentage of people qualifying for federal disability benefits because they are unable to work rose from 0.7 percent of the size of the labor force in 1960 to 5.3 percent in 2010.
This rising trendline is not produced by changes in the legal definition of physical disability or the pool of people who qualify for benefits. Both have been tweaked but not substantially changed since 1960. Increases in substance abuse don’t explain it (substance abuse is not a qualifying disability). Maybe some of the growth in the 1960s can be explained by disabled people first learning about the program. But the rest of the trendline reflects in part an increase in the number of people seeking to get benefits who aren’t really unable to work – an increase in Americans for whom the founding virtue of industriousness is not a big deal anymore.
Labor force Participation
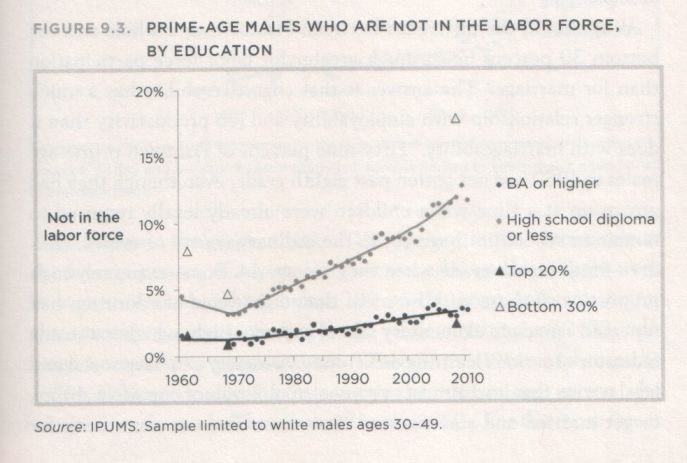
If you believe in the importance of industriousness among prime-age males, there’s no benign explanation for the gap. I have already pointed out that disability and illness should have made the line go the other way. Nor can we blame increased unemployment that created discouraged workers – the average white unemployment rate in 2004-8 was actually a bit lower (4.5 percent) than it had been in 1960-64 (5.1 percent). A substantial number of prime-age white working-age men dropped out of the labor force for no obvious reason.
Hours of Work
… By the end of the 1980s, almost half of Belmont men reported that they worked more than forty-eight hours in the preceding week. The percentage of hardworking Belmont men began to slack off in the 2000s, drifting down to 40 percent by 2008. But that still left a gap between the work effort of prime-age Belmont men and Fishtown men that was more than twice the gap that had separated them in 1960.
“It’s the Labor Market’s Fault”
“Jobs didn’t pay a living wage.” … Recall figure 2.1 at the beginning of the book, showing stagnant incomes for people below the 50th income percentile. High-paying unionized jobs have become scarce and real wages for all kinds of blue-collar jobs have been stagnant or falling since the 1970s. But these trends don’t explain why Fishtown men in the 2000s worked fewer hours, found it harder to get jobs than other Americans did, and more often dropped out of the labor market than they had in the 1960s. On the contrary: Insofar as men need to work to survive – an important proviso – falling hourly income does not discourage work. [...]
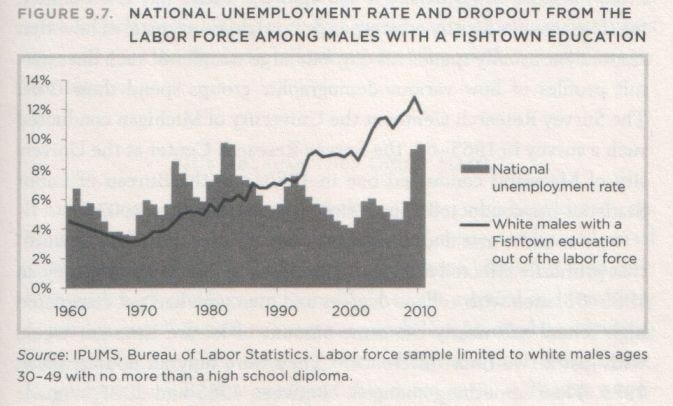
“There weren’t any jobs.” … What about all the previous years when dropout from the labor force was rising in Fishtown but jobs were plentiful? The last twenty-six years we are examining coincided with one of the longest employment booms in American history, as shown in figure 9.7.
… But after the mid-1980s, the argument that “there weren’t any jobs” loses force. Unemployment went down, but dropout from the labor force among white males with a Fishtown education continued to increase. … “Help wanted” signs were everywhere, including for low-skill jobs, and the massive illegal immigration that occurred during those years was underwritten by a reality that everyone recognized: America had jobs for everyone who wanted to work.
Inside the black box. … What was going on with these men who were no longer employed or were not even looking for work? … Economists Mark Aguiar and Erik Hurst gave us another kind of look inside that black box with their analysis of American time-use surveys from 1965 through 2005. “Time-use surveys” ask respondents what they did on the previous day, separated into fifteen-minute increments. At the end, the entire day is accounted for. … The Survey Research Center at the University of Michigan conducted such a survey in 1965-66, the Survey Research Center at the University of Maryland conducted one in 1985, and the Bureau of Labor Statistics has conducted annual time-use surveys since 2003. 10
Aguiar and Hurst document what they call an increase in “leisure” that primarily affected men with low education. In the first survey, in 1965-66, men with college degrees and men who had not completed high school had nearly the same amount of leisure time per week, with just a two-hour difference. 11 They were only an hour apart in 1985. Then something changed. “Between 1985 and 2005,” Aguiar and Hurst write, “men who had not completed high school increased their leisure time by eight hours per week, while men who had completed college decreased their leisure time by six hours per week.” 12
When Aguiar and Hurst decomposed the ways that men spent their time, the overall pattern for men with no more than a high school diploma is clear. The men of Fishtown spent more time goofing off. Furthermore, the worst results were found among men without jobs. In 2003-5, men who were not employed spent less time on job search, education, and training, and doing useful things around the house than they had in 1985. 13 They spent less time on civic and religious activities. They didn’t even spend their leisure time on active pastimes such as exercise, sports, hobbies, or reading. All of those figures were lower in 2003-5 than they had been in 1985. How did they spend that extra leisure time? Sleeping and watching television. The increase in television viewing was especially large – from men with no more than high school diplomas also goofed off more in 2003-5 than in 1985, but less consistently and with smaller differentials. 14
“It’s Because They Didn’t Marry”
… Men with high earnings are more likely to get married and less likely to get divorced. 15 But there’s another possibility: Married men become more productive after they are married because they are married. … George Gilder predicted it even earlier, in Sexual Suicide, through a more inflammatory argument: Unmarried males arriving at adulthood are barbarians who are then civilized by women through marriage. … The responsibilities of marriage induce young men to settle down, focus, and get to work.
… married men make 10 to 20 percent more money than unmarried men, even after controlling for the usual socioeconomic and demographic factors. … it cannot be a simple case of women choosing to marry men who are already more productive – the marriage premium occurs after the wedding vows have been taken. [...]
Participation in the labor force. … Using an analysis that controls for the year and the unemployment rate, unmarried white males ages 30-49 with a college education were 3.6 times more likely to be out of the labor force than their married counterparts in 1960 and 3.5 times more likely in 2010. 19 Among those with no more than a high school diploma, the comparable ratios were 3.9:1 in 1960 and 3.7:1 in 2010. [...]
Men who worked fewer than forty hours per week. … unmarried college-educated men were 1.5 times as likely as married college-educated men to work fewer than forty hours per week in both 1960 and 2010. For men with just a high school diploma, unmarried college were 1.7 times more likely to work fewer than forty hours a week in 1960 and 1.6 times more likely to do so in 2010.
Chapter 10 - Honesty
Neighborhood Trends Over Time
Imprisoned Neighbors
… For every 100,000 Fishtowners ages 18-65 in 1974, 213 were imprisoned. By the time of the 2004 survey, that number was up to 957. And those numbers are based on just state and federal prisoners. They don’t count people in jails, who amounted to around 100,000 whites in 1974 and 317,000 whites in 2004.
… The parallel numbers for Belmont were 13 in the 1974 survey and 27 in the 2004 survey.
The Neighborhood Crime Rate
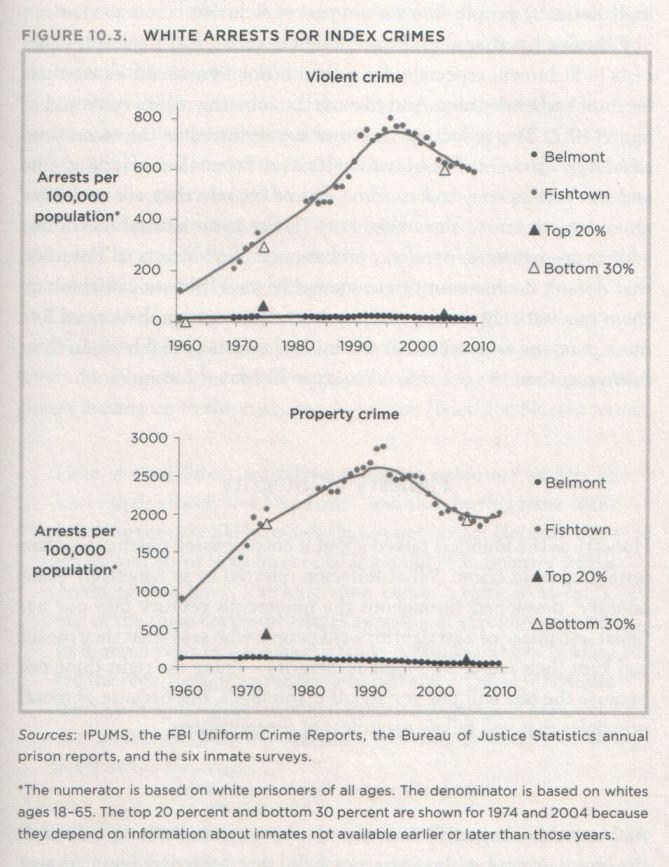
Fishtown has shared in the reduction in crime, but the levels of arrests in Fishtown, especially for violent crime, remain far above their levels of earlier decades. And there is the sobering reality conveyed in figure 10.2. The reduction in crime has occurred at the same time that large numbers of Fishtown males have been taken off the streets and put into prison, and to some degree because they are no longer around to victimize their neighbors. There is no natural metric for adding up prisoners, parolees, probationers, and arrests in Fishtown that doesn’t double-count in unknowable ways, but we can combine them qualitatively. Lots more prisoners, lots more probationers, lots more parolees, and somewhat diminished arrests probably mean that, taken together, the rise in criminality in Fishtown continues.
Honesty as Integrity
… The topic is integrity – doing the right thing not because the law will put you in jail if you don’t, but because of moral principles that you follow regardless of consequences.
Integrity in Personal Finances
Personal bankruptcies have always been legal in the United States as a way of giving people a second chance. Some famous Americans have availed themselves of that remedy, notably Mark Twain. But Americans have also seen the act of reneging on a debt as dishonorable. Twain was part of this tradition, too, eventually repaying all his debts despite having no legal obligation to do so.
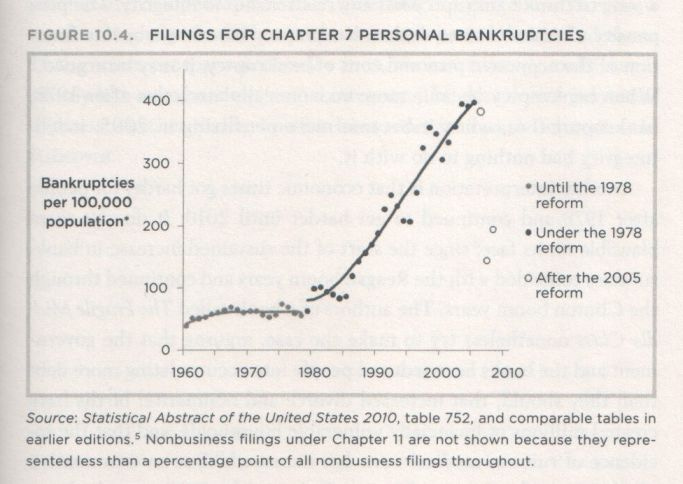
The quantitative indicator I use is a particular kind of bankruptcy, now known as Chapter 7 bankruptcy, in which the bankrupt walks away without any further attempt to repay debts. 4 I restrict it to personal bankruptcies, to avoid conflating some important differences between personal and corporate bankruptcies. Persons declaring bankruptcy under Chapter 7 are required to sell most or all of their assets (the states have varying requirements) to pay off as much of their debt as possible, and legally free to ignore the unpaid remainder. [...]
… How are we to interpret this history? One possibility is that I am wrong to think bankruptcy has any relationship to integrity. The propensity to declare bankruptcy has always been a function of the economic pros and cons of bankruptcy, it may be argued. 8 When bankruptcy became more economically attractive after 1978, bankruptcy rose; when it became more penalizing in 2005, it fell. Integrity has nothing to do with it.
Another interpretation is that economic times got harder for people after 1978 and continued to get harder until 2010. It doesn’t seem plausible on its face, since the start of the sustained increase in bankruptcies coincided with the Reagan boom years and continued through the Clinton boom years. The authors of a book called The Fragile Middle Class nonetheless try to make the case, arguing that the government and the banks have seduced people into accumulating more debt than they should, that increased divorce and nonmarital births have created millions of financially vulnerable households, and that the incidence of ruinous medical costs has increased. 9 But an examination of all personal bankruptcy filings in Delaware for 2003 casts doubt on the proposition that the increased bankruptcies can be blamed on events beyond people’s control. Divorce and unemployment were seldom implicated. Medical costs played a secondary role. The main cause of bankruptcy was imprudent expenditures on durable consumer goods such as houses and automobiles. 10
A third interpretation is that the propensity to declare bankruptcy has changed and that integrity has deteriorated. Have the bankruptcy laws become more lenient? To respond to the increased leniency by declaring bankruptcy more readily is akin to deciding to shoplift if the criminal justice system becomes more lenient. Are the banks offering credit too easily? Someone for whom integrity is paramount is scared of incurring debts that can’t be repaid, and doesn’t take out the loan. Is a woman facing a divorce? Someone for whom integrity is paramount changes her lifestyle, drastically if necessary, to avoid the shame of being unable to repay her debts.
I am not arguing that people of integrity never declare bankruptcy. Rather, I am arguing that there are always temptations to get into debt and always patches in life where finances become dicey. In a nation where integrity is strong, the effects of temptations and of rough patches are damped down. That trendline in figure 10.4, showing a quadrupling of personal bankruptcies over a period that included one of the most prosperous decades in American history, looks suspiciously like a decline in personal integrity. [...]
Chapter 11 - Religiosity
Religion’s role as a source of social capital is huge. “As a rough rule of thumb,” Robert Putnam wrote in Bowling Alone, “our evidence shows [that] nearly half of all associational memberships are church-related, half of all personal philanthropy is religious in character, and half of all volunteering occurs in a religious context.” 1 … Robert Putnam again:
Religious worshippers and people who say religion is very important to them are much more likely than other persons to visit friends, to entertain at home, to attend club meetings, and to belong to sports groups; professional and academic societies; school service groups; youth groups; service clubs; hobby or garden clubs; literary, art, discussion, and study groups; school fraternities and sororities; farm organizations; political clubs; nationality groups; and other miscellaneous groups. 2
… Various studies have found that active involvement in church serves as a kind of training center for important civic skills. 3 All of these relationships hold true even after controlling for demographic and socioeconomic variables.
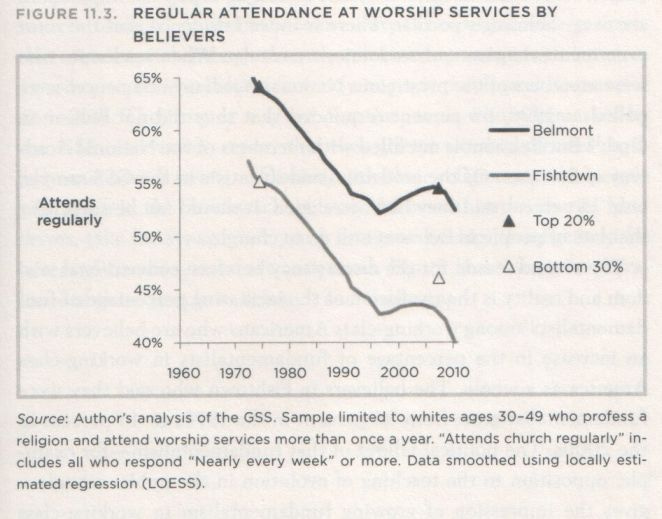
Religious Involvement Among Believers
Chapter 14 - The Selective Collapse of American Community
Social Capital and Class
The case for the ongoing collapse of American community was first made by Harvard political scientist Robert Putnam in his best-selling book Bowling Alone. 9 Adopting the social scientists’ name for neighborliness and civic engagement, social capital, and assembling data from a multitude of sources, Putnam devoted a chapter each to six types of activity: volunteering and philanthropy, political participation, civic participation, religious participation, connections in the workplace, and informal social connections. … Here is a sampling of indicators on the other issues, and how much they changed through the mid-1990s: 10
Voted in the presidential election: Down 22 percent from 1960 to 1996. 11
Attended a public meeting on town or school affairs: Down 35 percent from 1973 to 1994.
Served as an officer of some club or organization: Down 42 percent from 1973 to 1994.
Worked for a political party: Down 42 percent from 1973 to 1994.
Served on a committee for some local organization: Down 39 percent from 1973 to 1994.
Percentage of parents with children under age 18 who are members of the PTA: Down 61 percent from 1960 to 1997.
Average membership rate in thirty-two national chapter-based associations: Down by almost 50 percent from 1960 to 1997.
Times per year that people entertain friends at home: Down 45 percent from 1975 to 1997.
“Our whole family usually eats dinner together.” Percentage of married Americans who answer “disagree”: Up 69 percent from 1977 to 1999.
United Way contributions as a percentage of personal income: Down 55 percent from 1963 to 1998.
Membership in men’s bowling leagues per 1,000 men ages 20 and older: Down 73 percent from 1963 to 1998 (while the number of bowlers continued to increase).
There’s much more, but these examples will serve to make the point. Measure it however he might, Putnam found the same thing: consistent and widespread evidence, direct and indirect, that America’s social capital had seriously eroded.
Collapse of the Possibility of Community
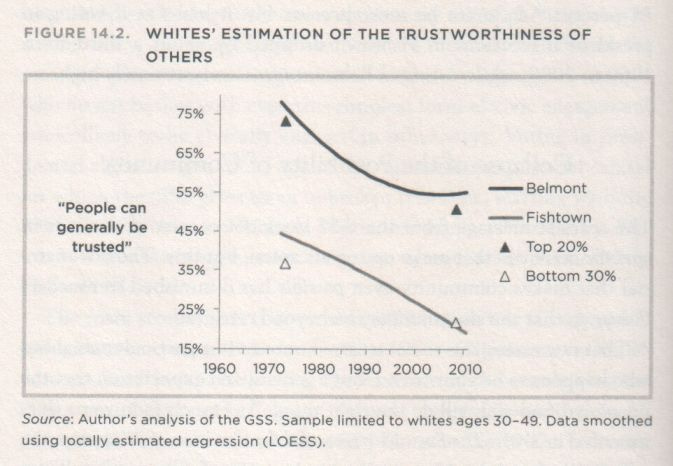
The results for both trust and fairness make sense in light of the other changes in life in Fishtown. If in recent decades you lived in a neighborhood that has become much more densely populated with people who will cheat, rob, assault, and perhaps even murder you, you would be a fool not to have become more untrusting and less likely to assume that other people will treat you fairly. Correspondingly, the people of Belmont live in a world where neighbors are pretty much as they always were, and it makes sense that their optimism about their fellow human beings has not fallen as much. But they also live in a society in which, once they leave the confines of Belmont, they have to watch their backs more carefully than they once did, so their trust in their fellow countrymen in general has dropped as well.
… In the years father Bowling Alone appeared, Robert Putnam’s research led him to a disturbing finding: Ethnic diversity works against social trust within a community – not only against trusting people of the other ethnicity, but against trusting even neighbors of one’s own ethnic group. In addition, Putnam’s research found that in areas of greater ethnic diversity, there was lower confidence in local government, a lower sense of political efficacy, less likelihood of working on a community project, less likelihood of giving to charity, fewer close friends, and lower perceived quality of life. [see Robert D. Putnam, 2007, pp. 149-150]
Chapter 15 - The Founding Virtues and the Stuff of Life
What Happens When Income Is Added to the Equation?
The analyses reported so far have not included income as a control variable, and yet it has consistently been found that, at any given slice of time, rich people are more likely than poor people to say they are happy. I have ignored that consistent relationship because it has just as consistently been found that the relationship is not causal after abject poverty has been left behind. Longitudinal evidence reveals that people don’t get happier as they go from a modest income to affluence. [See Arthur C. Brooks, 2008, Gross National Happiness, ch. 5 & 6]
The relationship exists in a cross section of the population because the qualities in individuals that make them happy in their marriages, satisfied with their work, socially trusting, and strongly involved with their religion are also qualities that are likely to make them successful in their jobs. In addition, marriage itself, independent of the personal qualities that produced the marriage, increases income – both by combining two incomes in some cases and because of the marriage premium discussed in chapter 9. Conversely, people who have a failed family life, are dissatisfied with their jobs, are disengaged from their communities, and have no spiritual life tend not to be happy because of those failures – and the same qualities that produced those failures also mean that, as a group, they are likely to have depressed incomes. Controlling for income as an explanation of happiness is as likely to mislead as to inform, wrongly attributing to income effects that are actually the result of qualities that produce both happiness and high income.

