This is a copy-paste (nearly) of the appendix I have recently made for a paper published at OpenPsych. I found it difficult to navigate, so I believe it needs to be clarified. This makes replication much easier.
The National Center for Education Statistic (NCES) website allows us to use their data for making tables, correlation and regression but not to have raw data sets (except for few exceptions).
Here's a list of useful webpages :
http://nces.ed.gov/surveys/
http://nces.ed.gov/surveys/international/ide/
http://nces.ed.gov/nationsreportcard/naepdata/
Let's begin with BPS and NPSAS. If we want to use them, we have to go there. And select "Postsecondary" and then select our survey. We will illustrate with BPS.
We click on PowerStats (twice).
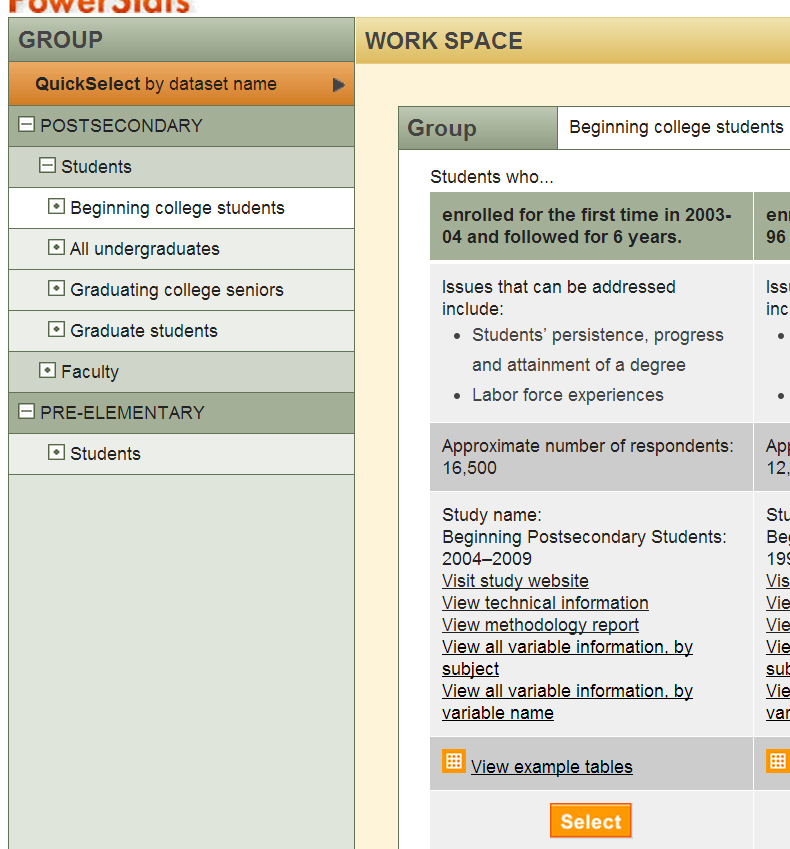
We select "averages, medians and percents". And the group of postsecondary students "Beginning college students" and click on select.
We select the variables we need (e.g., SAT/ACT, student born in US, parents born in US, race/ethnicity). If we put the variable "student born (in US)" under the filter, we will be asked to select yes or no, which will allow us to examine the groups by generations (1st, 2nd, 3rd). When we are done, we create the table and we accept to use the sampling weight suggested (WTB000).
If we are interested in the TIMSS, PISA or PIRLS, we need to go to this webpage. And select the survey study. We choose the TIMSS USA to illustrate.
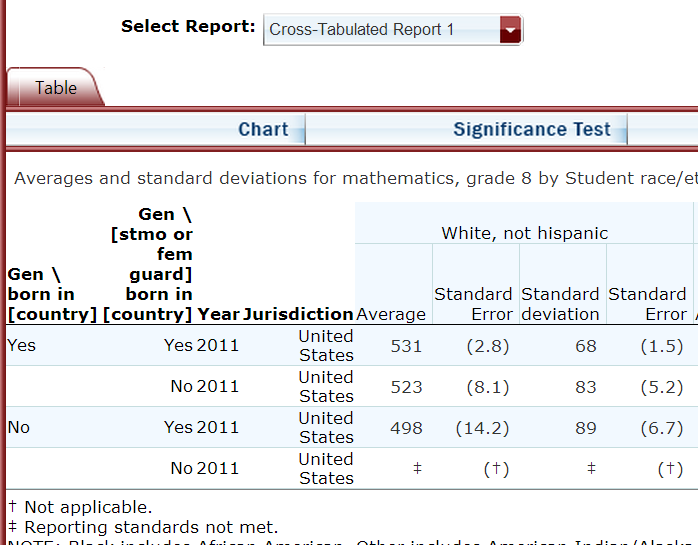
In step 1, Select Criteria, select Mathematics, Grade 8. In step 2, make sure that "TIMSS Mathematics Scale: Overall Mathematics" and "United States" as well as the survey year (2011) we are interested in, are selected. In step 3, click on "Student and Family Characteristics" and select the variables Student race/ethnicity (collapsed) (U.S. only), Gen\born in [country], Gen\[stmo or fem guard] born in [country] under the Sub Category Race/Ethnicity, Native or Foreign Born (Self), Native or Foreign Born (Parents). Make sure we select the variables that are available for the survey year(s) we study.
Then, we select Statistics Options, "averages" and "standard deviations". We now arrive to Step 4. We choose to display the cross-tabulated report. The column mother's country is displayed after the child's country. But note the order may change depending on the order we have selected our variables.
If we want to analyze the NAAL, we need to go to this page. And then download the data, e.g., NAAL_2003_PDQ. But we also need the AM program at this webpage.
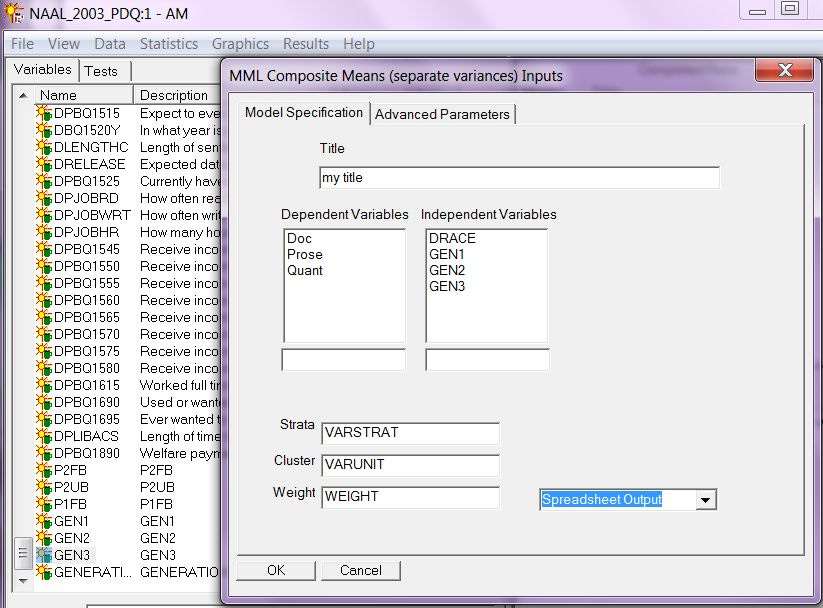
When right-clicking on a given variable, we can examine its values with "edit meta-data". But we will set values to missing if it equals 4. Then we go to create new variables based on father/mother country of birth (1=US, 2=other). For example, F2FB means 2 foreign born parents, so father and mother coded as equal to 2 (i.e., other countries).
We choose to calculate the means for the selected subgroups as illustrated above. Finally, we (can) ask AM to generate the ouput in a spreadsheet format.
If we need to analyze NAEP data we have to go here. This one is straightforward. We first click on the data we need (Main NDE, LTT NDE, etc.), then select math, reading or other NAEP tests, select the grade level (4, 8, 12) or age (9, 13, 17), and in the next step, select the years, measure, and jurisdiction (national, national public) and if needed we click on "detail" to get the description of what the variable is. Next, we have a series of variables, mostly demographic, school and community variables. We again need to be careful as to whether the variable(s) we are interested is available for the year(s) we study. Next step will define the statistics options, once again. Create our cross-tabulated tables. In fact, the interface (and procedure) is just the same as with TIMSS/PIRLS/PISA.


