Orlich & Gifford (2006) published an analysis that shows high correlation between parental income and SAT scores. All those correlations are close to 100%, in fact, around 0.97 or 0.98. This is more than twice the usual effect size we see in the literature, even corrected for measurement errors and some other artifacts. Just unbelievable.
The article can be found here.
Test Score, Poverty and Ethnicity - The New American Dilemma (Orlich, Gifford, 2006)
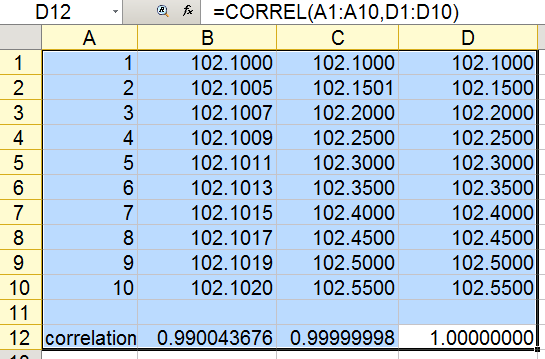
I have reproduced below their method. Although they haven't clarified, it was clear that they have computed the mean SAT score within each category (1 through 10) of parental income. Then, they calculate correlation based on the SAT column and income column, with 10 rows each.
But it may not be how correlational analyses must be carried out. Here's why.
The A column corresponds to the 10 categories of income (from the lowest category to the highest) just like the first table. The B, C, or D column is an IQ score. These correlations clearly hit 100% and yet the IQ difference is meaningless. It does not move at all. Poor people have 102 points and rich people 102 points as well. So, what's the point ? Such a procedure is worthless without knowing the shift in IQ score per income category, and correlation cannot show us this information. When the income variable is built in such a way that IQ increases at each category, this certainly ensures the correlation is high. But too high to be true.
In the data given by Orlich & Gifford (2006) the lowest income category had a score of 422 and the highest had a score of 533. How could we know how much that effect is ? Perhaps looking at the percentile distribution.
Interpreting and Using SAT Scores
The above paper gives the number. Verbal SAT of 420 corresponds to the 21th percentile whereas Verbal SAT 530 corresponds to the 56th percentile. A non-trivial shift but somewhat disappointing given the large difference in income between these two categories. Whereas the correlation in the first table is similar in size to that in the second table, the effect sizes are simply not comparable. That is not the way correlations should work. A correlation is an effect size expressed in standard deviation shift. Correlations must be comparable. But in the present case, that's not it.
To better illustrate that the means and correlations can be independent from each other, we can remember what Flynn said about the increasing IQ scores over time combined with a decreasing achievement test scores (e.g., SAT) during the same period. The correlations between the two is and remains high, and yet both went in opposite directions. The following picture gives the response to this apparent paradox.
Between 1950 and 1990, IQ increased by 20 points and SAT decreased by 60 points for each age. These numbers are obviously fictitious but show that even if the correlation between IQ and SAT is 100% in both cases the means can differ substantially and in different directions across time and cohorts. They need not be equivalent. This is because the correlation deals with score rank-ordering, and only rank-ordering, across the individuals or subgroups of the group they belong to. If all individuals are affected by a score improvement to the same extent, then, no distortion in the rank-order will occur in this group.
Correlations are still very useful to get an insight about development. If children are adopted at young ages by adoptive parents having different IQ ranking than that of the biological parents. Let's say the IQ rank-ordering of the children aged 2 is correlated with the rank-ordering of their biological parents. If adoption is effective, then, it would affect cognitive development and children having the more intelligent and educated (adoptive) parents will show the greatest IQ scores at later ages. On the condition of random assignment, we assume the scores of adoptive and biological parents are not correlated (0.108), and by the same token, the IQs of the adopted children are not expected to be correlated (negatively or positively) with the IQs of the adoptive parents (-0.053).
Here, we see that children’s scores aged 2 and 22 are barely correlated (0.116). The reason is because children's score rank-ordering at early age correlates with their parents' IQ rank-ordering (0.414) while it is not at adulthood (0.036). We observe a null correlation between children aged 2 and adoptive parents but a meaningful correlation when they become adults. Although the correlation does not tell us anything about the magnitude of the IQ changes, it tells us something about whether or not having more intelligent parents helps to develop greater IQ levels. As detailed elsewhere, adoption studies are somewhat deceptive.


