In the NLSY97, a Jensen Effect of biracial blacks has been found, using self-reported white ancestry. In the NLSY79, some questionnaires (R00096.00, R00097.00) asked about the respondents' first and second racial/ethnic origin. When the respondent reported being non-black or white in one of the questionnaires and black in the other, he was categorized as being a multiracial.
I will use the same technique as was done in the NLSY97, namely, Jensen's method of correlated vectors. I found a total of 55 mulattoes, and 156 multiracials. The 'mulatto' variable specified blacks with white (i.e., european) ancestry, while the 'multiracial' variable specified blacks with non-black ancestry, that is to say, blacks with some mexican ancestry, or asian ancestry, or indian (american) ancestry, or white ancestry, and so forth.
The magnitude of the BB(blacks)/BW(mulattoes) gap in the g and non-g sources in ASVAB subtests can be estimated first by factor analyzing (using PAF) the 10 ASVAB subtests and producing two unrotated factors, the first explaining 58% of the total variance, the second 11%. Using then the scores in g factor and non-g factor, derived from a comparison of means program (in SPSS), I produced the following table :
The pooled sd formula estimated a non trivial gap of around 0.43 SD or 6 points difference between blacks and mulattoes. The difference, as expected, was smaller between blacks and multiracials (0.36 SD). In any case, the non-g source of variance is trivial and the sign is even negative, which means that blacks outsmart multiracials in non-g sources. Another technique is the use of partial correlation between the multiracial dichotomized variable (1=black, 2=multiracial) and each ASVAB subtests, with PAF1 as a control variable. The correlations fell near zero, but this was not the case when PAF2 is used as control variable (syntax here). This means that g is the source of those differences. The point-biserial correlations (before partialling out g) were not very high as shown below :
Excel file here. One reason for these low correlations could be that the frequency distribution of the dichotomized variable is far from being optimal. As I pointed out before, the departure from an optimal 50/50 split of any dichotomized variable will reduce the obtained correlations. For instance, the frequency distribution for my mulatto variable is 0=3024, 1=55, and for my multiracial variable 0=2925, 1=156. The relevant formulas for correcting unequal sample sizes in point-biserial correlations are provided by Hunter & Schmidt (2004, p. 280). This explains why the rpbs for multiracial are larger than rpbs for mulatto even if the d gap is smaller using the multiracial variable. After correction for unequal sample size, using Hunter & Schmidt formulas (with Excel functions), I produced the following table :
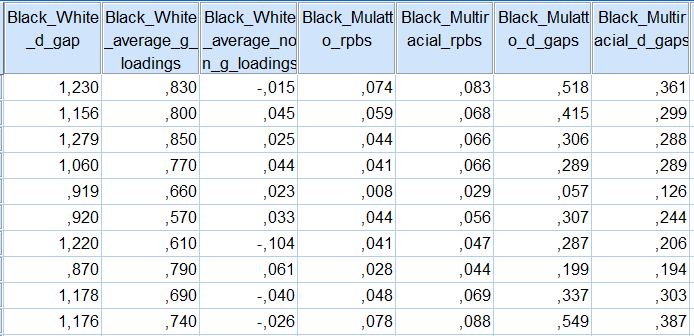
As can be seen, the corrected rpbs for Mulatto variable seems a little bit higher than rpbs for Multiracial variable. For AFQT (2006 revised) the corrected rpb is around 0.22 (by way of comparison, the ASVAB 1999 BB-BW gap shows a corrected rpb of 0.28, and uncorrected rpb of 0.19). In any case, using either corrected or uncorrected rpbs, we can estimate the correlation between the magnitude of BB-BW difference and the magnitude of black-white d gap, B-W g loadings, B-W non-g loadings, as shown below.
For obtaining these correlations, I use the estimates of B-W g-loadings and non-g-loadings, as well as B-W d gap reported in my earlier post on IQ regression to the mean (Hu, April.19.2013). Given this, the Jensen effect is apparent, and to this can be added another Jensen effect test by Chuck (May.9.2013) in another article on the Scarr et al. (1977) admixture data among US blacks.


