After analyzing the NLSY97, it appears that religious and rich people reported to be more happy. But controlling for health reduces the influence of these variables. This holds true not only in the white sample, but also in the hispanic and black samples. Nonetheless, one must read my article on multiple regression before going any further. It seems that the regression coefficients do not estimate the total effect but only the direct effect of the independent var on the dependent var. I created the Happiness variable by averaging the scores of the NLSY questionnaires such as “how often R has been a nervous person in past month”, “calm and peaceful”, “felt down or blue”, “has been a happy person”, and “often depressed”. All these questions have been administered in 2000, 2002, 2004, 2006, 2008, 2010. Averaging these scores allows us to increase the reliability of the characteristic being measured. To note, CALM and HAPPY need to be reversed because higher values meant less happiness.
The income variable has been computed by averaging the income estimates from 2005 to 2010. Grade is the number of years of education (going from 0 to 20). ASVAB 1999 the measure of cognitive abilities.
The Attend_Worship_Services variable assessed the number of times “R attended worship services in past 12 months”. It has been administered every year since 2000. All the variables have been collapsed into a single one, using again the aggregation method.
The Health variable “how is Rs general health?” has been asked every year since 1997. I average the scores of all these questionnaires for the same reason. Higher values mean bad health, not better health. In other words, a positive correlation between health and, say, IQ would mean that high IQ is associated with bad health, not better health.
The gender variable is coded like this : 1=male, 2=female. Thus, a positive correlation between gender and, say, happiness would mean that females are happier than males. for BDATE (alias birth date), higher values denote, of course, the younger respondents. To note, there is some range restriction in the age variable in the NLSY97.
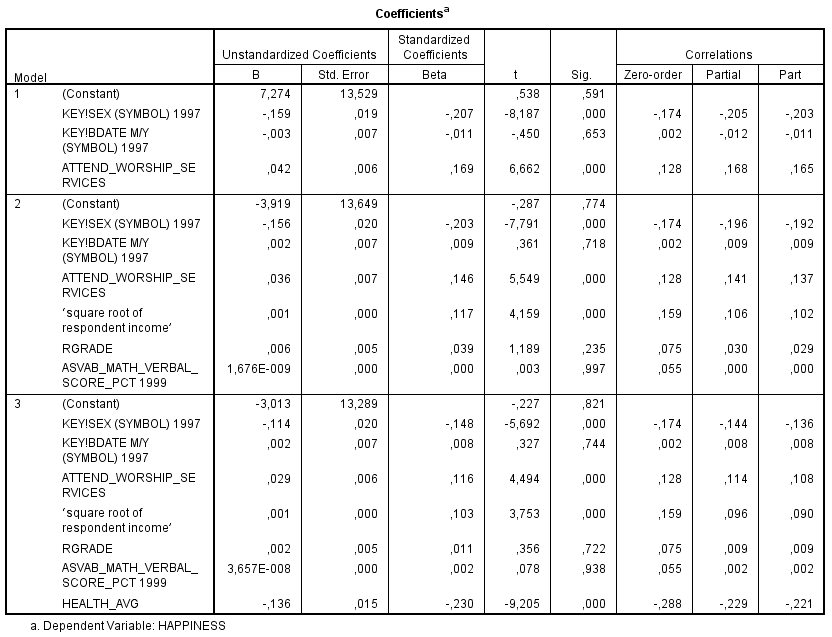
First, let’s see what the results for the black sample looks like :
In model 3, where health has been included, we see that the relationship between religiosity and happiness as well as income and happiness has decreased. But they are still positive, with 0.116 for religiosity and 0.103 for income. Bad health, of course, is the more important predictor of all (-0.230). Strangely, the negative sign of sex variable shows that black women are less happy than black men. I would have expected otherwise with all those black men murdered and incarcerated, among other problems associated with their lifestyle.
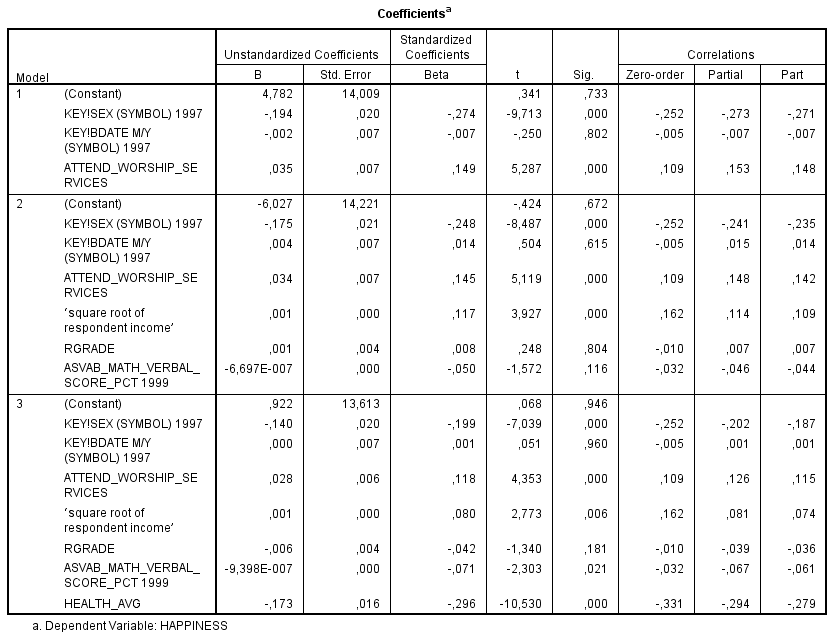
Second, we see that the hispanic sample displays a similar pattern :
The gender variable is strongly negatively associated with happiness (-0.199), even when all other variables have been taken into account, thus meaning that hispanic women are less happy than hispanic men. I have no explanation for this. But still, attend and income remains positively associated with happiness, although their influence diminished after health has been entered in model 3. In any case, attend (0.118) is once again more important as a determinant of happiness than is income (0.080), which is probably not what most people would have expected. And here again, bad health remains the most important independent variable with a Beta coefficient of -0.296.
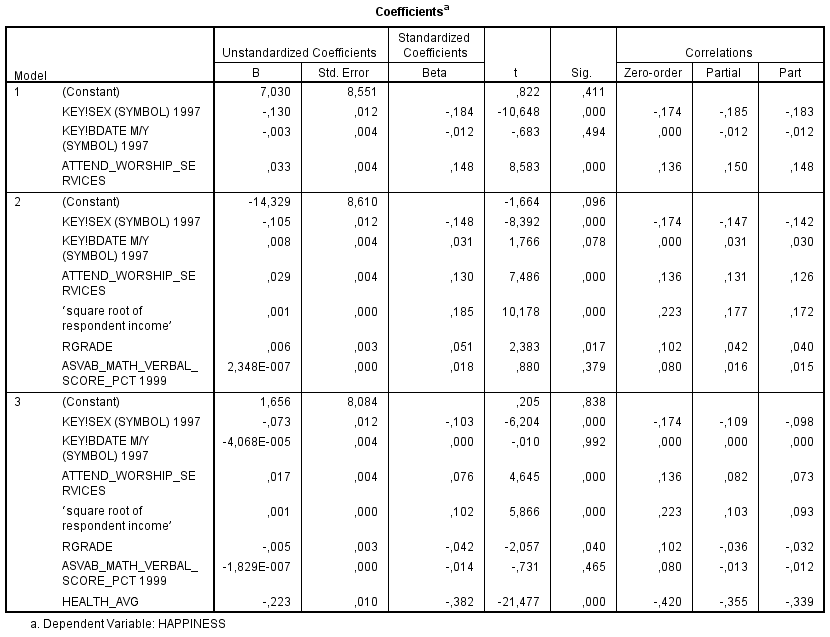
Finally, the white sample displays a somewhat similar pattern :
Although the influence of gender is lower, the coefficient is a negative -0.103, meaning that women tend to report less happiness. Also, the independent influence of religiosity (0.130) and income (0.185) has been reduced to 0.076 and 0.102, respectively, from model 2 to model 3, once health has been controlled. Bad health, net of income, intelligence, education and religiosity is strongly negatively associated with happiness (-0.382).
The reason why the effects of income and religiosity decreased after holding constant health is simply that income and religiosity are independently associated with better health. When conducting a regression analysis with health as a dependent variable, income and religiosity are independently associated with better health. For income, it is easy to understand why. For religiosity, there are two alternatives : 1) people having a poor health tend to be less religious obviously because of their bad outcomes 2) religious people have a much healthier lifestyle.
In any case, the popular belief that income is really what matters is not confirmed in the NLSY97. Health clearly emerges as the better predictor. This means that rich people are not happier just because they are rich, but essentially because of their better health. It is health that brings happiness. Another warning regarding the moderate association of income with happiness is about the arrow of causation. It can be argued that income itself leads to happiness but it could also be the result of the characteristics that produce both happiness and high income; in the latter case, the link is not causal. Finally, the possibility of “focusing illusion” effect must not be neglected (Kahneman, 2006). The SPSS syntax for the above analysis is given here.
Related article : More children for more happiness ? What is happiness ?


